2014 Student Blog Post #3: Alexander Whydell
My name is Alexander and I’ve just completed my first year of my undergraduate studies at Michigan Technological University. I’m excited to learn about archaeology and was glad I could enroll in the field school without having taken too many required intro courses first. Like others on the research crew, I’ve spent the first few weeks learning how to control for space as we work. Making maps seems pretty central to archaeological fieldwork! I can explain what we’ve been doing by giving you the example of the Catholic cemetery in Clifton and our work at that part of the site this May and early June.

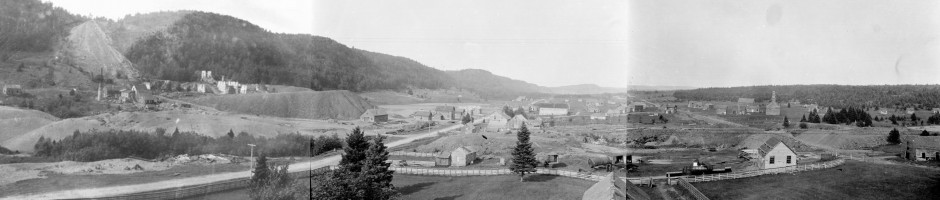
Author Alex Whydell (in white shirt) with the mapping crew in the Clifton’s Catholic cemetery. The other team members are (from left to right) Daniel Schneider, Daniel Conner, John Arnold, Christopher Edwards.
Our first step in constructing a map of a new part of the site was to define a starting point—or, actually, a starting line. Our team established a line roughly parallel to one face of the probable cemetery boundary, as determined by a cursory exploration of the site. The survey team then evenly spaced ourselves along this “datum line,” which worked out to be slightly less than 3m apart, and began our pedestrian survey of the site. This preliminary step is a controlled approach to assess surface features of the site in which the team visually sweeps the site in a prescribed manner, walking away from and perpendicular to the datum line. Detected features, such as headstones, are temporarily marked with removable survey flags to facilitate later data capture with either measured triangulation or the use of an optical transit. In the sketch below, the Datum Line is the line between A and B.

This is an unmeasured field sketch of the foundation of the St. Mary’s Church at Clifton (the Catholic Church). We established “Control Points” around the foundation, marked on this sketch by the letters A through F.
Because we can use a long fiberglass tape measure to pull a straight line, we can know for sure that the line has a certain length. Starting from these two points, we can build a map taking measurements in different ways.
The triangulation method uses two or more tape measures to find the location of an object – in this case the corner of a grave marker – in relation to other points on the map. These additional points could be anything from nails that the group planted in the ground just for mapping purposes (such as Datum E on this sketch) or they could be other grave markers that are nearby. One tape is stretched from the first pre-recorded point to the landmark as accurately as possible and the measurement is recorded.
The same process is repeated from another pre-recorded point towards the same landmark in as straight a line as possible. The aim is to limit the amount of interference caused by trees, small mounds or depressions, slopes, and other obstacles so that the measurement is not too distorted when drawn on the map (projecting reality onto a flat paper). To gain an even more accurate location, it is advised to draw measurements from at least three known points towards the new landmark that will be added. The more measurements that are recorded, the more accurate and realistic the placement of the marker is when added to the map. For example, the measuring team will record the distances A to F, B to F, and E to F and then A to D, B to D, and E to D.

Plotting points onto a map Michigan Tech’s planing table. Hand drawings are an important part of the learning process in archaeology.
A draftsperson then uses a compass and scale to translate the arc of each measurement around each known point on the map. In the case above, to plot the new point F on the map, the draftsperson scales the compass to measure the distance between A and F, puts the point anchor on Point A on the drawing, then draws the an arc at that distance. Then they use the scale to set the compass to the correct distance from B to F, anchor on B and draw that arc. Finally, they repeat the process to draw the arc from point E. Where the three arcs intersect, the new landmark is added to the scaled map. The survey continues building this mesh-like network of points over the cemetery until all the observed features have been drawn to scale on the map.
During the course of the surveying it quickly became apparent that this method was the fastest way to set up, and as such required less time to generate a data table for the recorded points, so long as the mapping project was a small site. As the number of points increased, this became more laborious and problems did arise using this approach. One of the biggest problems with using measuring tapes to locate a landmark in an area with trees and undergrowth is that the trees may block the direct route to the targeted landmark. The only way around this problem was to thread the tape as straight as possible through the trunks and branches so as not to distort the reading too much. Changes in elevation can also distort the measurement, so the team raised the tape measures and pulled them taught, using plumblines to center the tapes over the points being measured to (and from).
This method was also used in the Hillside cemetery, where the surveying team was creating a map that displayed the locations of remaining grave markers and depressions in the ground which could have been where the grave was removed and interred elsewhere. Students began to refer to these depressions as PUGs (Potentially Unmarked Graves), a more generic term since the same depression can be caused by the subsidence of the grave as the fresh fill compacts over time or following the decay and collapse of a coffin lid. The team encountered problems with elevation changes, pine trees, and hawthorn bushes. There were few immediate problems with the initial populating of the map since the ground was flat and there was little interference from the brush. When measuring over long distances, however, then the environment became more problematic. The hawthorn bushes would tangle up the tapes as the team tried to measure through them, the Hillside cemetery sloped downward over a large area (hence the name!), and there were fallen trees and tree limbs in highly inconvenient positions throughout the cemetery with some being easier to clear out of the way than others.
In all, we were able to build very good measured sketch maps which the digital mapping team could use when they came through and these plots served to help us organize our data as we studied and recorded the grave markers and historic plants, like very old trees or patches of flowers or ground cover.

Thanks for explaining what a PUG is. The graveyards are interesting. If you read Hobert’s book he talks about some of the folks in the town, then to find their final resting place of some of these folks or their kids it is sort of an interesting closure to his mentions.